Analytics has always been an important part of what we do. It’s the foundation of our campaigns whether for an SEO strategy, PPC or website redesign project. Analytics tell us a lot about what we do, who our client really is (sometimes more than our client does), helps us plan, helps us adjust and ultimately guides us. It can do a lot or it can do a little depending on how you use it.
We have our favorite customizations to help us work more efficiently. Personally, I’m a fan of things “at a glance” and the Dashboard section has been great at allowing us to quickly see the health of a campaign. I also get quick access to more in-depth information using the “Custom Reporting” section in Google Analytics. Here’s a little starter guide.
To set this up, head to the “Custom Reporting” tab in Google Analytics. You’ll find it in the top navigation.

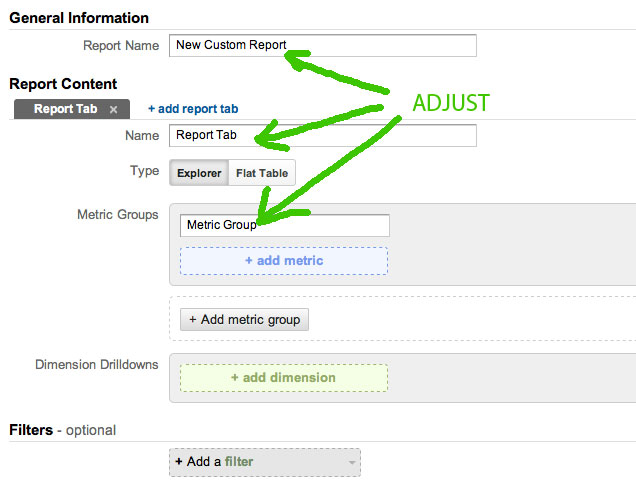
Select the + New Custom Report option and you get their default options. Change the Report Name to whatever you want along with the Report Content “Name”. You can choose any name as long as it makes sense.
Next is where personal preference comes in and it’s often dependent on your website and company needs. Let’s have a look at the Metric Groups. These are my preferences and at first, it might be good to copy them and play around on your own later (it’s not set in stone).

My Metric Groups in order are:
Visits – total number of visits to the website. Gives you an overall perspective
Bounce Rate – I want to see the quality of visitor coming to my website. This may be a skewed metric depending on your type of website but something I still like to see
Goal Completions – I’m fairly conservative with my Goal setups so this metrics gives me a very good idea of conversion data at a glance.
Goal Conversion Rate – because I suck at math, I like to be provided with this number so I don’t have to think.
Goal 1, Goal 2, Goal 3 Completions – Here’s where you lay the goals side by side depending on what you want to include.
Transactions – If it’s an e-commerce website, this is important and gives you a look at number of transactions rather than percentages.
Revenue – bottom-line stuff here.
So it should look something like this

Next section will be the Dimension Drilldown. This gives you a look at more details, first at a glance and then by digging in a little further.
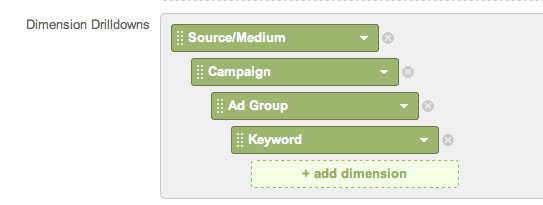
We’re going to do the same thing we did for the metrics and choose some options that I think are important. Again, go ahead and include my selection and then choose your own preferences later. Here are my faves:
Source/Medium – love to know where they came from
Keyword – mostly valuable if you are doing SEO
If you’re doing Paid Search then I’d add “Campaign” and “Ad Group”. It should look something like this.
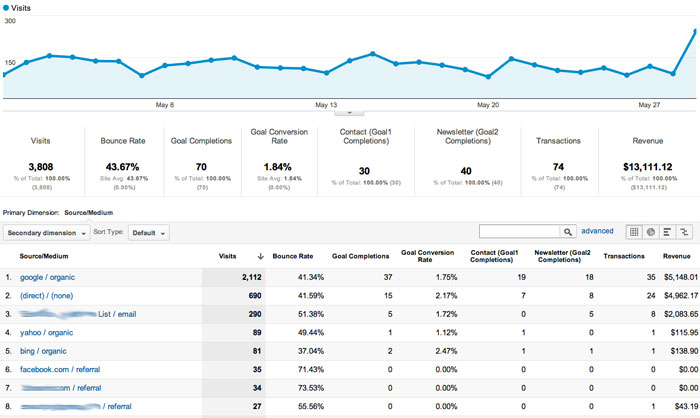
Now, we’re done with the setup. Go ahead and save it and you should see some data. Don’t forget to adjust the date range as needed. What you see should look something like this:
If you go ahead and click on one of the search engines, it should take you to the keyword level where you can actually see the data at that level to find out which phrases are driving revenue. Nice.
This basic overview should get you started on Custom Reporting in Google Analytics. When you’re feeling confident, go ahead and mess around with different metrics and dimensions to suit your needs. Any time you need to pop back and have a look, just head into the Custom Reporting Section, click on it and there it is.
If you want to shortcut this process, click here and add it to your own profile auto-magically.


10 Replies to “Our Favorite Search Marketing Google Analytics Custom Report”
Is there a limit to the number of custom reports that can be made?
We certainly haven’t come up against the issue Matt but we’re under the impression that it’s 100. There are also limits to the metrics and variables you can use within the actual report which can be cause for some frustrations but 100 seems plenty for most of our campaigns.